Assorted Bitcoin Graphs
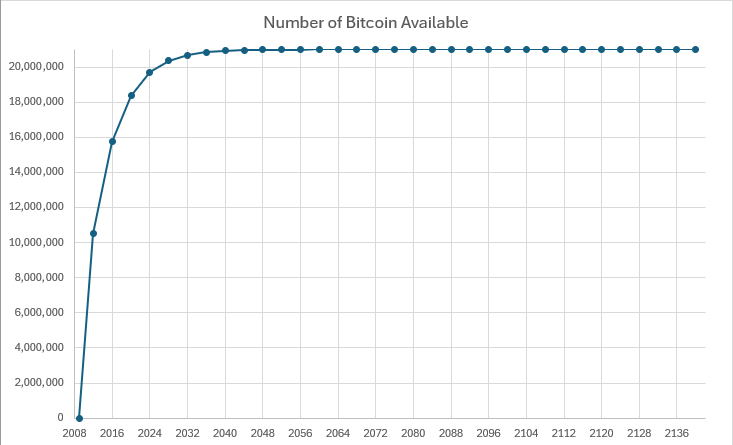
1. Total Bitcoin Supply Curve
Tracks the total cumulative Bitcoin mined over time, showing the logarithmic approach toward the 21,000,000 hard supply cap across halving epochs.
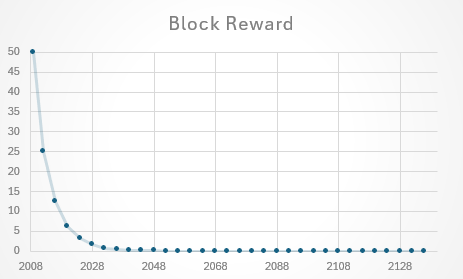
2. Block Reward Step-Down Schedule
Visualizes the programmatic decay of the block subsidy, halving every 210,000 blocks starting from 50 BTC in 2009 down toward zero.
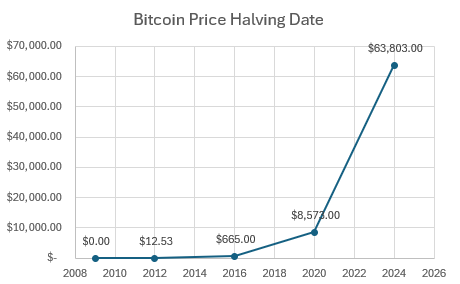
3. Bitcoin Price on Exact Halving Dates
Highlights the spot price of Bitcoin on the exact calendar day of each halving event, tracing the long-term price expansion from $0.00 in 2009 to $63,803.00 in 2024.
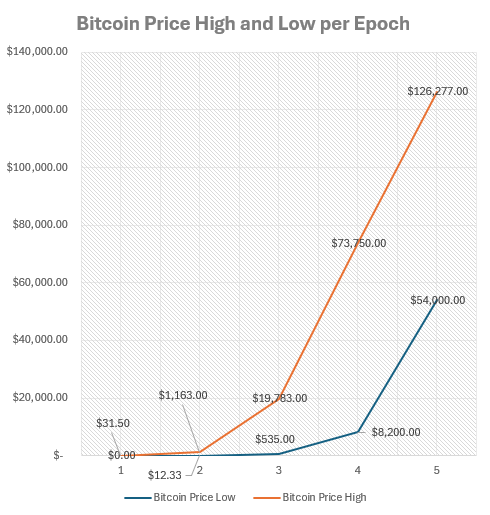
4. Bitcoin Price Highs and Lows per Epoch
Compares cycle bottom lows against cycle peak highs recorded across each four-year halving epoch from Epoch 1 through Epoch 5.
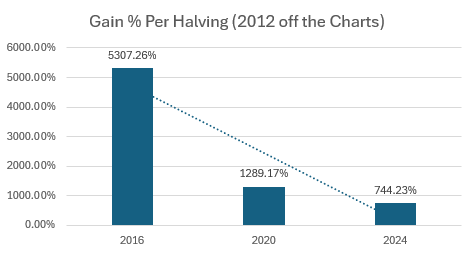
5. Percentage Gain per Halving Cycle
Measures post-halving performance gains across cycles, illustrating the diminishing percentage return trend as Bitcoin's market capitalization grows (excluding 2012's initial off-the-charts expansion).
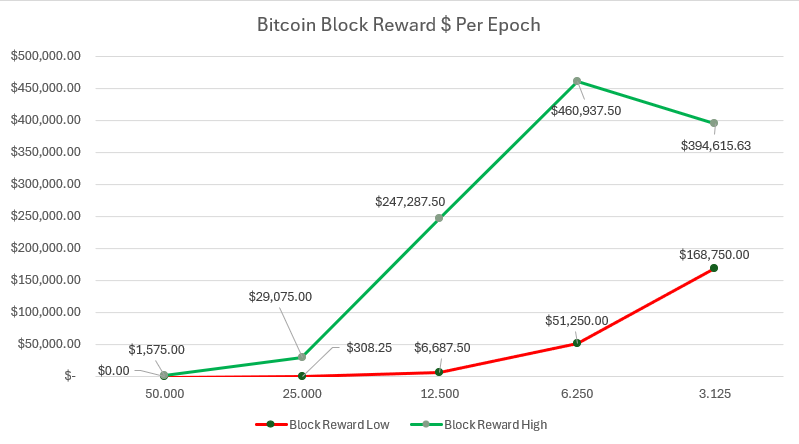
6. Dollar Value of Block Rewards per Epoch
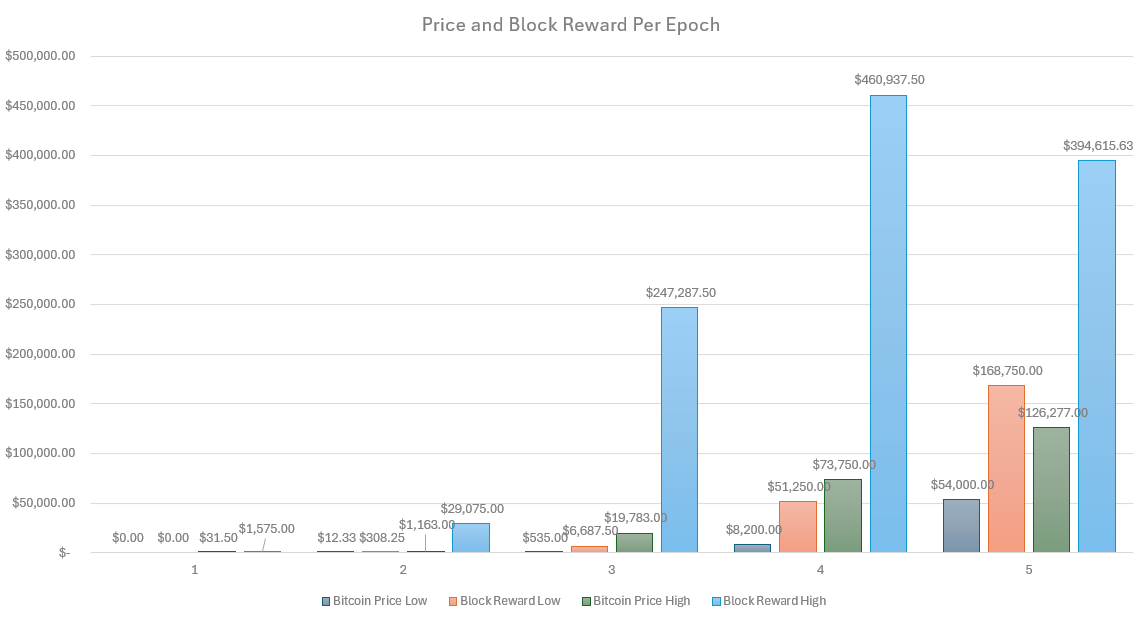
Tracks the nominal USD value of a single block reward at each epoch's price high versus its price low, showing how fiat price appreciation outweighs declining BTC issuance.
7. Side-by-Side Price and Reward Valuation
A grouped comparison evaluating Bitcoin's price floor and peak against the total fiat value of block subsidies generated across Epochs 1 through 5.